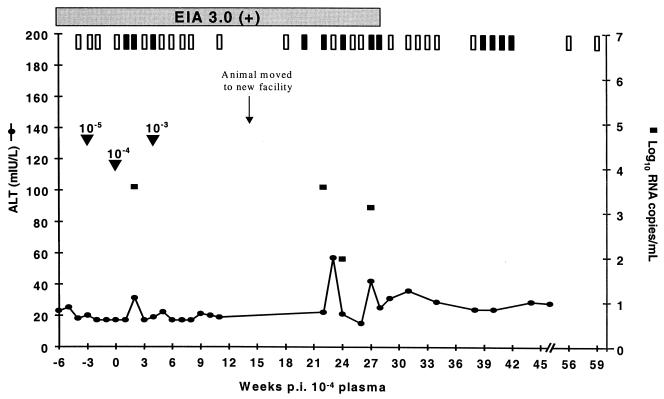
FIG. 2.
Clinical response of Ch1552 to challenge with increasing doses of plasma from Ch1536. Arrowheads indicate the dates of challenge with increasing doses. Weeks postinoculation are counted as postchallenge with the 10−4 dilution of plasma. Results from nested PCR are indicated at the top of the graph. Vertical open bars represent negative PCR signals, and vertical filled bars represent positive PCRs. Serum positivity in Ortho EIA 3.0 is indicated by a horizontal shaded bar.

