
Figure 2.
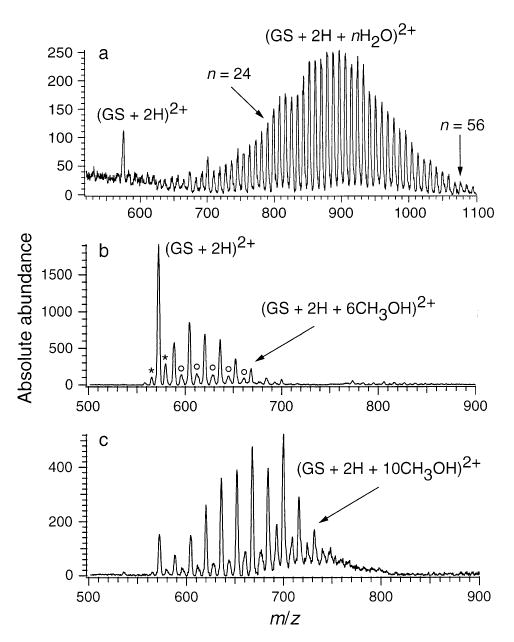
(a) ESI mass spectrum of gramicidin S (M + 2H + n H2O)2+ ions obtained from an aqueous solution; ESI mass spectra of gramicidin S obtained from a MeOH solution at (b) high and (c) low inlet capillary temperatures. Asterisk indicates impurities 14 Da above and below the mass of gramicidin S. Second distribution (open circles) is due to mixed methanol/water clusters on gramicidin S and/or the impurities.