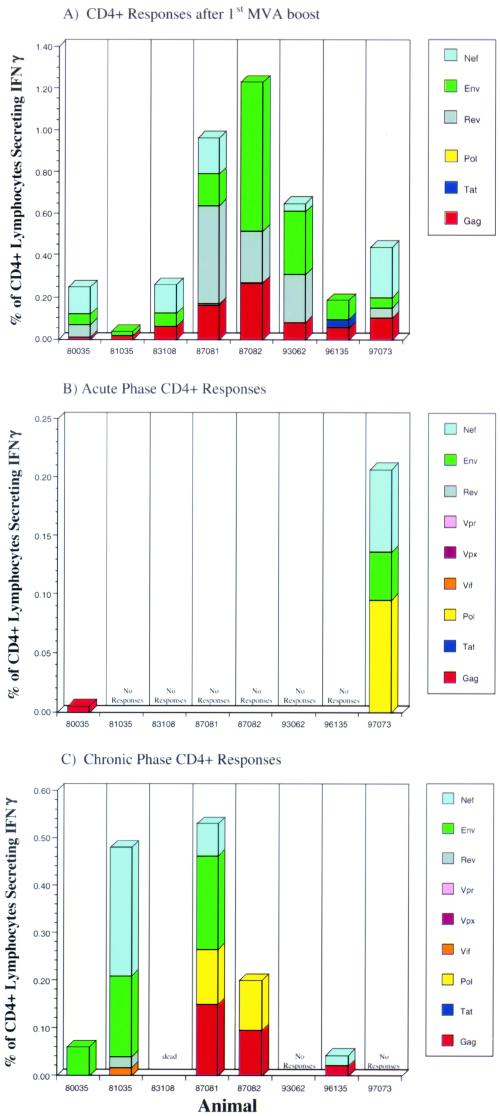
FIG. 3.
ICS data for virus-specific CD4+-lymphocyte responses in animals vaccinated with DNA/MVA. The frequency of responding CD4+ cells against each protein is shown. These frequencies were obtained as described in the legend to Fig. 2. CD4+ responses after the first MVA boost (prior to infection), 2 weeks postinfection (acute phase of infection), and 12 weeks postinfection (chronic phase of infection) are shown.

