
Figure 4.
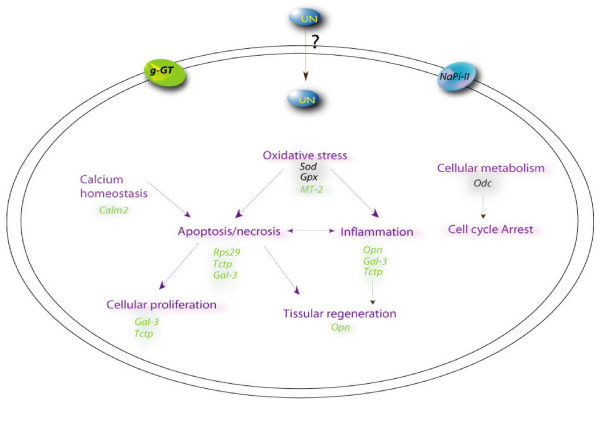
Putative cellular pathways of UN-mediated nephrotoxicity. The diagram depicts the putative pathways involved in UN-mediated toxicity. This schematic was assembled using the gene expression data from 2 days UN treatment and previous litterature. Up- or down-regulation is denoted by different colors (green and black, respectively). Mechanisms (in purple) such as oxidative stress, apoptosis, inflammation and perturbation of calcium homeostasis might contribute to uranium toxicity. Secondary compensatory mechanisms were evident as increases in tissue regeneration and cellular proliferation.