
Figure 3.
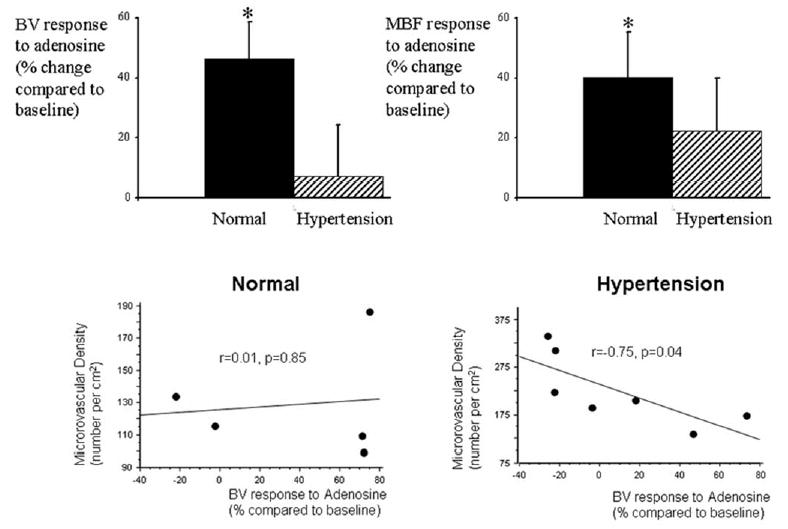
Top, Electron-beam computed tomography (EBCT)-derived myocardial blood volume (BV, left) and myocardial blood flow (MBF, right) responses to adenosine in (% change compared to baseline) in normal (n=5) and HT (n=7) animals. * p<0.05 compared to baseline. Bottom, Correlation between microCT-measured microvascular density and EBCT-derived BV response to adenosine in the anterior wall of control (left) and HT (right), showing that in HT, but not in control, there was significant inverse correlation between microvascular structure and function.