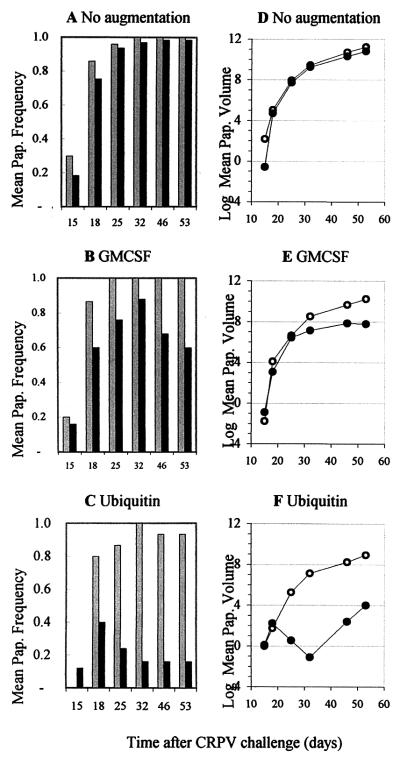
FIG. 2.
Time course of papilloma formation, regression, and growth in rabbits vaccinated with the E6 gene without augmentation (A and D), after GM-CSF priming (B and E), and after ubiquitin fusion (C and F). (A to C) Mean proportions of challenge sites with papillomas. The control groups are represented by gray-shaded bars; the E6-vaccinated groups are represented by black bars. Note that papilloma frequencies may not reach the maximum number of positive sites (which are given in Table 1) if some papillomas regress before others form. (D to F) Changes in mean papilloma volumes (in cubic millimeters) plotted on a natural logarithmic scale. Symbols represent the control groups (open circles) and the E6-vaccinated groups (closed circles).

