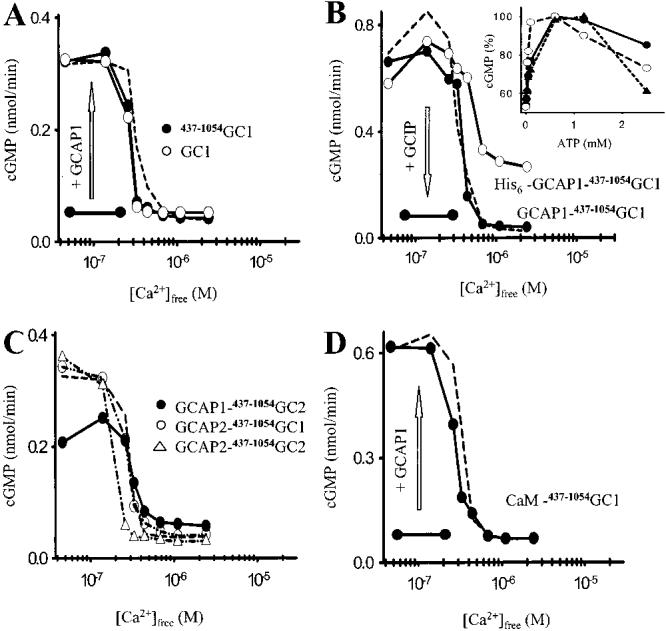
Figure 2.

Activity of GC constructs as a function of [Ca2+]free. (A) Activity of GC for full-length GC1 and truncated 437–1054GC1 (enzyme was stimulated by addition of exogenous, recombinant GCAP1). IC50 for GC1 was 230 ± 40 and 225 ± 34 nM for 437–1054GC1 (n = 3). (B) Activity of GC for GCAP1–437–1054GC1 and His6-GCAP1–437–1054GC1 (arrow shows competition of GCIP with GCAP1 in GCAP1–437–1054GC1 fusion protein at low [Ca2+]free). IC50 for His6-GCAP1–437–1054GC1 was 220 ± 34 nM. Inset: ATP titration of GC constructs (solid circles, GCAP1–437–1054GC1; open circles, 437–1054GC1 + GCAP1; open triangles, GC1 + GCAP1) in low [Ca2+]free. Similar results were obtained in three independent measurements. (C) Activity of GC for GCAP1–437–1054GC2, GCAP2–437–1054GC1, and GCAP2–437–1054GC2. IC50 values for GCAP2–437–1054GC1 and GCAP2–437–1054GC1 were 245 ± 74 and 255 ± 30 nM, respectively. (D) Activity of GC for CaM–437–1054GC1 after stimulation by addition of GCAP1. Arrow shows recovery of GC1 activity by reconstitution with GCAP1 in low [Ca2+]free. IC50 for CaM–437–1054GC1 was 195 ± 15 nM. The dashed line represents stimulation of ROS GCs by GCAP1. In all panels, the dashed line represents stimulation of ROS GCs by GCAP1.
