
Figure 4.
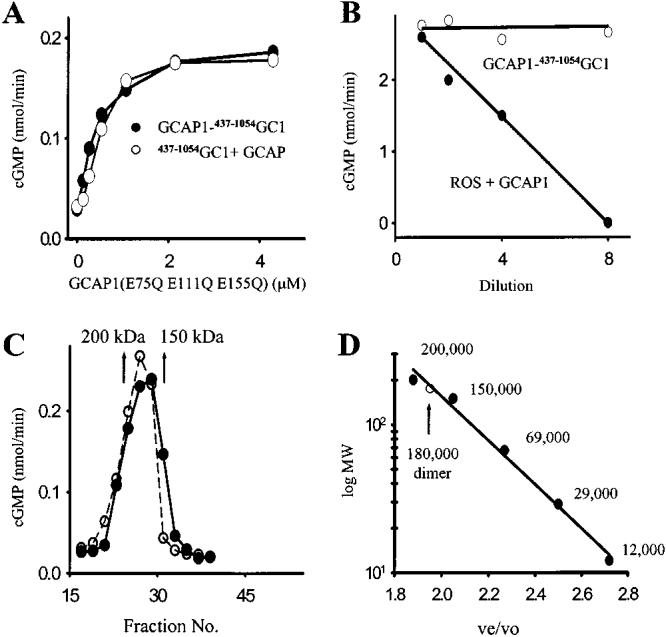
Intramolecular and dimeric nature of GCAP1–GC1-stimulated activity at low [Ca2+]free. (A) Competition of GCAP1–437–1054GC1 and 437–1054GC1 with GCAP1(E75Q E111Q E155Q) at 2 μM [Ca2+]free. The EC50 values were 0.8 ± 0.1 and 0.85 ± 0.1 μM for GCAP1–437–1054GC1 and 437–1054GC1, respectively. (B) Dilution effect on GCAP1–437–1054GC1 and GCAP1/ROS GC1 activities. Samples were diluted 0, 2, 4, and 8 times with increasing concentrations of all reagents in the assay at constant amounts of protein. Results are an average of two measurements. (C) Gel filtration chromatography. GCAP1–437–1054GC1 was loaded at 5 μM [Ca2+]free or with (gray circles and dashed line) addition of 1 mM EDTA (solid circles) on a Superose-6 column as described under Materials and Methods. Arrows show standards: α-amylase (200 kDa) and alcohol dehydrogenase (150 kDa). (D) The calibration curve for the gel filtration column. The standard proteins and compounds used were NaN3, cytochrome c (12 kDa), carbonic anhydrase (29 kDa), bovine serum albumin (67 kDa), alcohol dehydrogenase (150 kDa), α-amylase (200 kDa), and blue dextran (void volume, 2000 kDa) as the high molecular mass standard. The protein standards were detected at 280 nm, blue dextran at 450 nm, and azide at 260 nm. ve/vo is a ratio of the elution volume to void volume. The GC fusion protein eluted at a volume that corresponded to 180 kDa. Similar relationships for the retention time and molecular mass were obtained in three independent experiments.