
Fig. 5. Fluorescence properties of GCAP1 mutants modified by IANBD.
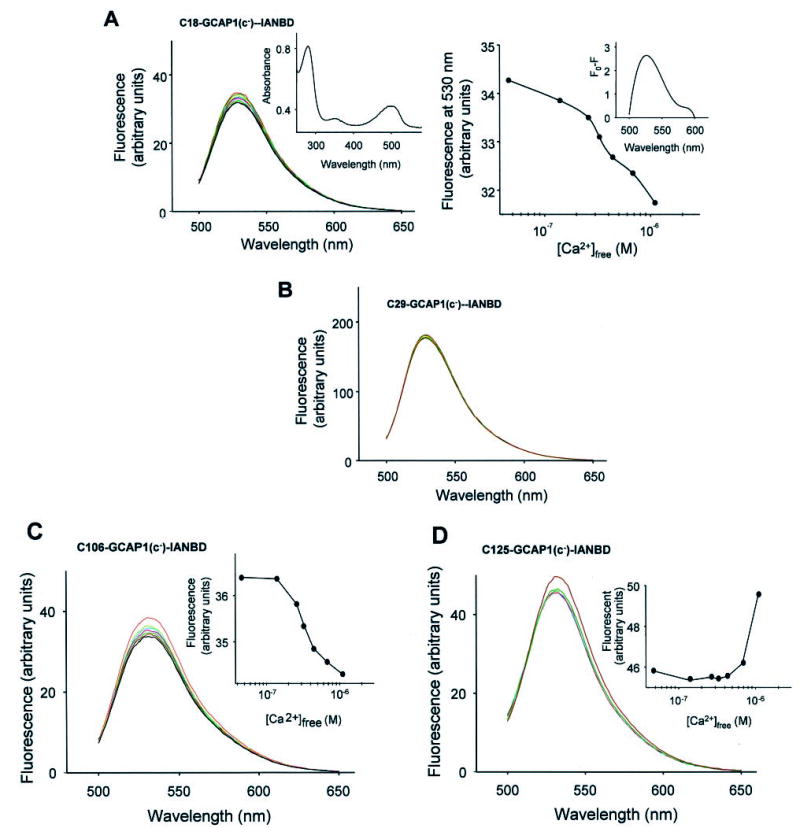
A, fluorescence emission spectra of C18-GCAP1(c−) modified by IANBD as a function of increasing [Ca2+]free (black at lowest concentrations and red at highest concentrations; λex = 480 nm). Inset, UV spectrum of modified C18-GCAP1(c−) mutant. Right panel, changes in fluorescence intensity as a function of [Ca2+]free. Inset, difference in the fluorescence intensity for C18-GCAP1(c−) at 40 nm and 2 μm [Ca2+]. B, lack of changes in the fluorescence emission intensity of C29-GCAP1(c−)-INABD at λem = 530 nm as a function of [Ca2+]free. C, fluorescence emission spectra of C106-GCAP1(c−) modified by IANBD as a function of increasing [Ca2+]free (black at lowest concentrations and red at highest concentrations; λex = 480 nm). Inset, changes in fluorescence intensity as a function of [Ca2+]free. D, fluorescence emission spectra of C125-GCAP1(c−) modified by IANBD as a function of increasing [Ca2+]free (black at lowest concentrations and red at highest concentrations; λex = 480 nm). Inset, changes in fluorescence intensity as a function of [Ca2+]free. The fluorescence measurements were done in duplicate, and the second set of data did not vary significantly from the set presented in this figure.