
Fig. 7. Plot of the relative center line height of C29-GCAP1(c−)-MTSL EPR spectra as a function of [Ca2+]free.
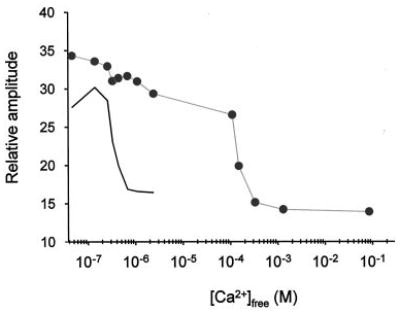
The decrease in the relative amplitude of the center line of each spectrum is a result of the changes seen upon addition of CaCl2 that leads to broadening of the spectra. A typical Ca2+ titration of GCAP1-dependent stimulation of GC activity is shown in black.