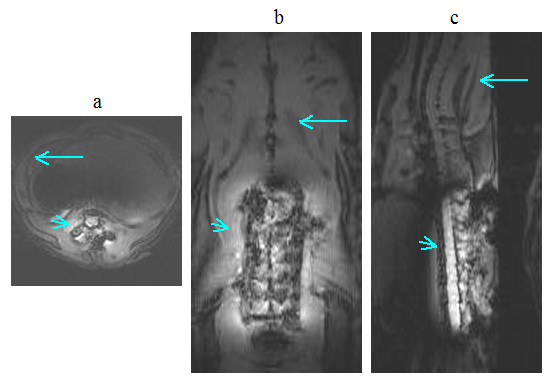
Figure 12.

In vivo gradient echo images of spinal cord in (a) axial, (b) coronal and (c) sagittal planes acquired on the day of coil implantation using the parameters TR/TE = 40 ms/3 ms, flip angle = 45°, image matrix = 128 × 128, slice thickness = 2 mm and NEX = 2, FOV = 45 mm × 45 mm for the axial, 35 mm × 85 mm for the coronal and 45 mm × 85 mm for the sagittal views. The intensities in the images were windowed and scaled to enhance the background signal. Notice that, during transmission, the volume coil generates an excitation field that leads to the hypointensity (long arrows) seen in the background. The implanted coil generates excitation field that produces the hyperintense footprint (short arrows).
