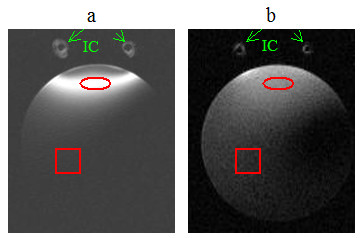
Figure 13.

Axial spin-echo (a) and gradient-echo (b) images of a 15 cc tube filled with 0.9% NaCl water solution. IC denotes implantable coil. The circles and squares respectively denote the regions of interest selected to measure the mean signal intensities in the excitation field of the implanted coil and the background regions excited by volume coil. The intensities in the images were windowed and scaled to enhance the background signal.
