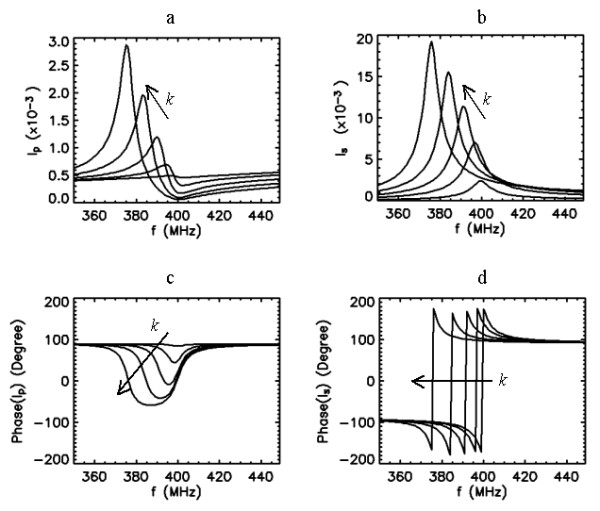
Figure 3.

Frequency response curves (amplitude and phase) of the primary (a,c) and secondary (b,d) coil currents for five different values of coupling coefficient k = 0.1,0.3,0.5,0.7 and 0.9, when Qp = Qs = 50, f0s = 400 MHz and f0p = 1000 MHz. Arrows indicate the direction of increased k values.
