
Figure 6.
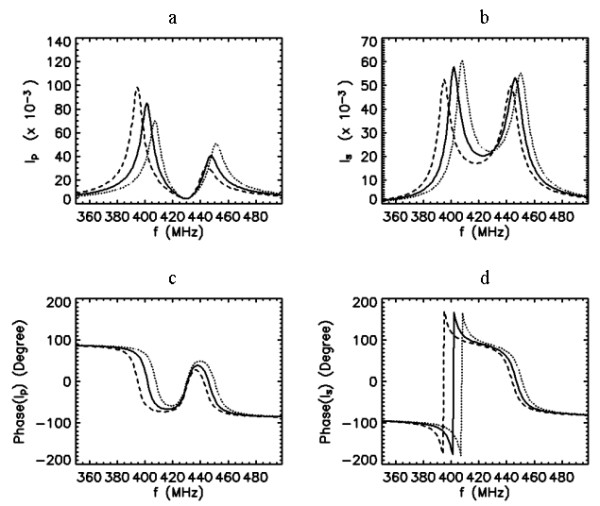
Frequency response curves of the primary (a,c) and secondary (b,d) currents when k = 0.1, Qp = 50, Qs = 50, and f0s = 430 MHz and f0p = 405 (dashed line), 415 (solid line) and 425 (dotted line) MHz.
Official websites use .gov
A
.gov website belongs to an official
government organization in the United States.
Secure .gov websites use HTTPS
A lock (
) or https:// means you've safely
connected to the .gov website. Share sensitive
information only on official, secure websites.
Frequency response curves of the primary (a,c) and secondary (b,d) currents when k = 0.1, Qp = 50, Qs = 50, and f0s = 430 MHz and f0p = 405 (dashed line), 415 (solid line) and 425 (dotted line) MHz.