FIG. 2.
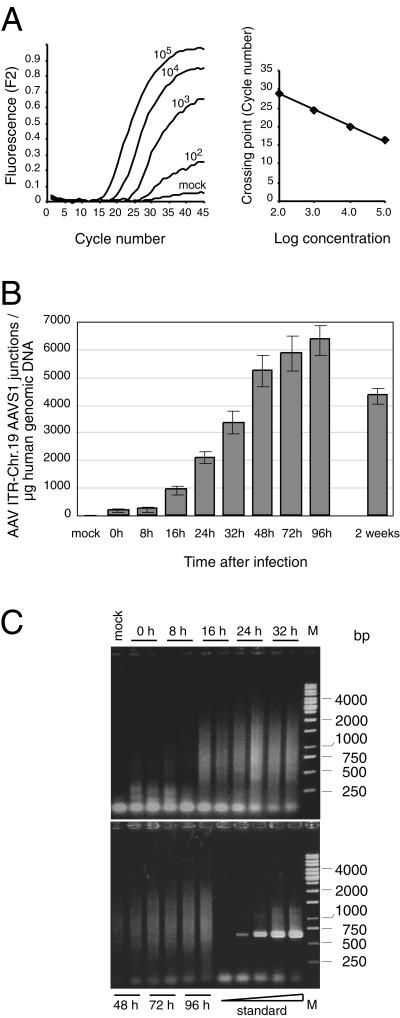
Kinetics of AAV site-specific integration. HeLa cells were infected with AAV-2 at an MOI of 500. Total genomic DNA was isolated at different times p.i. Purified DNA (1 μg) was preamplified in 50 μl for 13 cycles by conventional PCR. Samples of 2 μl were subjected to LightCycler PCR as outlined in Materials and Methods. (A) Raw data of the LightCycler analysis of HeLa cell DNA (1 μg) spiked with known copy numbers (102, 103, 104, and 105) of standard plasmid pAAVS1-TR. (B) The copy numbers of AAV ITR/chr-19 integration site junctions per microgram of AAV-infected HeLa DNA were quantified by comparison to values of a standard curve run in parallel as outlined for panel A. Each value represents the mean ± the standard deviation of three independent cultures. (C) LightCycler PCR products were analyzed on agarose gels. Standards were 101, 102, 103, 104, and 105 copies of pAAVS1-TR added to 1 μg of uninfected HeLa cell DNA. The bands in the range below 100 bp present in all lanes represent input primers. M, molecular size marker.

