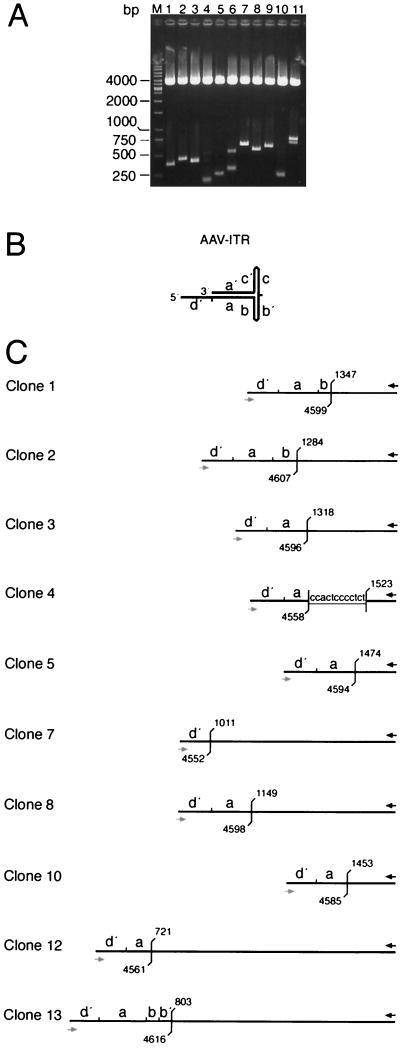
FIG. 3.
Analysis of PCR-amplified AAV ITR/AAVS1 site junctions. PCR fragments of the sample at 96 h p.i. (Fig. 2) were cloned into pCR4-TOPO. Colonies were picked at random. (A) DNAs were digested with EcoRI to release the PCR fragments. Agarose gel electrophoresis visualizes the variability of fragment lengths. (B) The hairpin structure of the AAV ITR is represented in the “flop” orientation. Small letters (d′, a, and b) indicate palindromic sequence elements of the right AAV ITR. (C) Structural maps deduced from DNA sequence analysis of cloned PCR fragments. With the exception of clones 12 and 13, clone numbers refer to the lane numbers in panel A. The black arrow indicates the hybridization site of primer PAAVS1 on chr-19. The gray arrow indicates the binding site of primer PITR on the AAV ITR. Positions of the last unambiguous cellular and/or viral nucleotide are indicated in accordance with the published sequence information (9, 23). Overlapping sequences between the AAV ITR and the chr-19 integration site are underlined.

