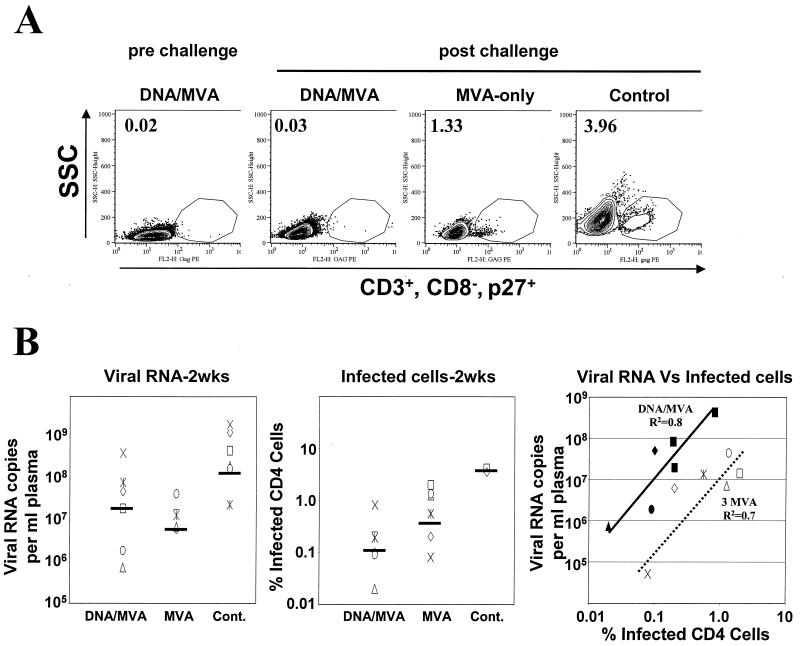
FIG. 5.
Viral loads and infected cells in the peripheral blood at 2 weeks postchallenge. (A) Intracellular p27 staining. PBMC were fixed and stained for intracellular Gag, CD3, and CD8. Cells were gated on lymphocytes, followed by gating for CD3+ and CD8−, and were then analyzed for Gag. The frequencies in the graph represent Gag-positive cells as the percentage of total CD4 cell levels. Representative data are shown for each group: animal 3 (prechallenge) and animals 3, 45, and 26 (postchallenge). (B) Comparison of viral loads and numbers of infected cells at 2 weeks postchallenge. Geometric means for viral RNA copies and percent infected CD4 cells are represented as horizontal bars on the respective graphs. Filled symbols represent the DNA/MVA-vaccinated animals, and open symbols represent the MVA-only-vaccinated animals. The diagonal lines represent the trend lines for the DNA/MVA-vaccinated animals (solid) and the MVA-only-vaccinated animals (dashed).

