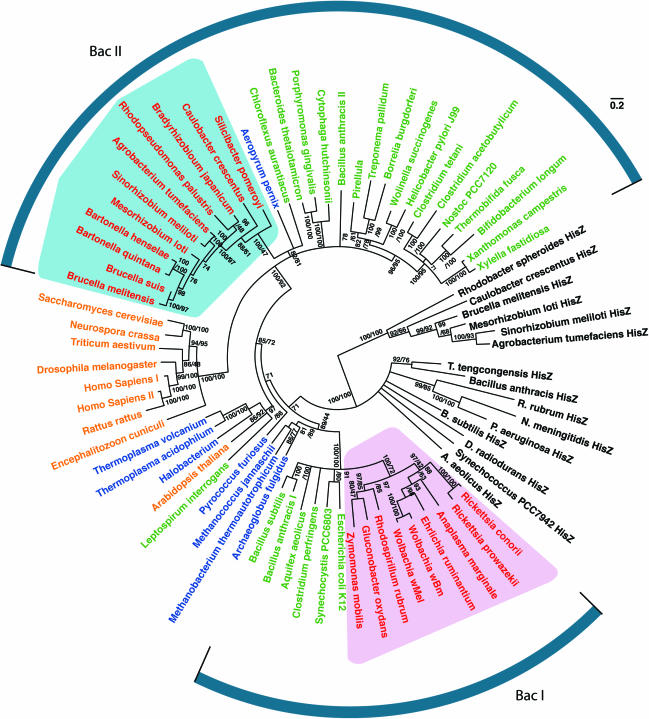
Figure 4.
An unrooted protein likelihood HisRS/HisZ phylogram. Sequences are colored by taxonomic source: α-proteobacteria in red, other bacteria in green, eukaryotes in gold and archaea in blue. HisZ sequences are in black. The RCS-clade is shaded in blue and the RZG-clade is shaded in pink, to correspond to the covariation with tRNAHis acceptor stems shown in Figure 2. The tree topology shows the consensus of 100 bootstrapped PHYML likelihood trees, where edges of less than 70% bootstrap support with likelihood were collapsed. Splits with two support values show likelihood and BIONJ percent bootstrap values in that order. Single split support values indicate support by likelihood only. Units of branch length are substitutions per site.

