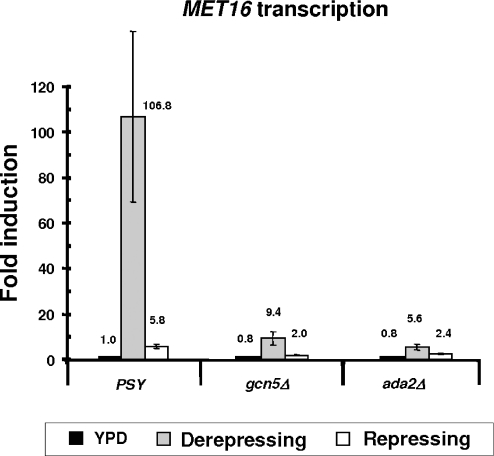
Figure 2.
MET16 transcription in PSY, gcn5Δ and ada2Δ cells following growth for 2 h in minimal medium with transcription derepressing (grey columns) and repressing (open columns) concentrations of methionine, as well as in YPD medium (closed columns). MET16 transcription induction is shown relative to the level detected in PSY cells grown in YPD medium (1×). Values have been corrected for differences in the loading by using an ACT1 probe. Data for each strain and growth condition correspond to the average from at least three different experiments.

