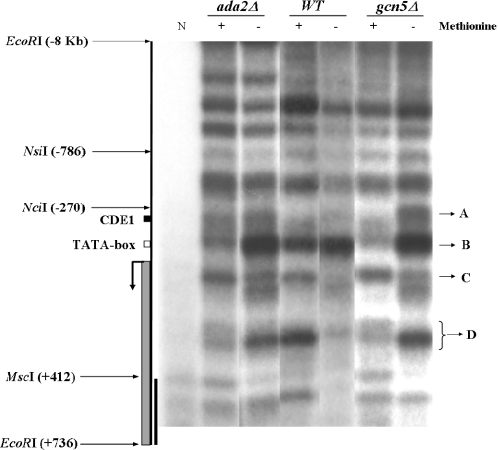
Figure 3.
MNase digestion pattern of the ≈9 kb EcoRI restriction fragment including MET16 of naked (N lane) and chromatin DNA isolated from the three strains grown for 2 h in minimal medium with transcription derepressing (10 µM, −methionine) and repressing (1 mM, +methionine) concentrations of methionine. Indicated are specific bands/regions as mentioned in the text. Relevant locus components and restriction sites are shown on the left. The black line between the MscI and EcoRI restriction sites corresponds to the probe used for the Southern blot.

