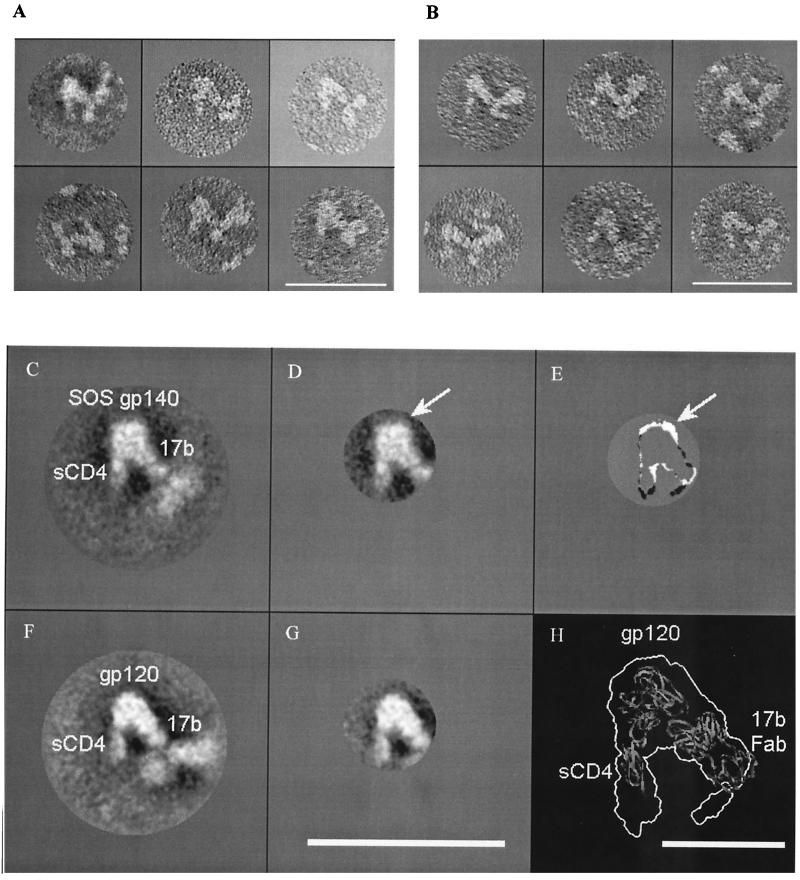
FIG. 4.
Individual, averaged and subtracted electron micrographs of SOS gp140 and gp120 in complex with sCD4 and MAb 17b. Panels A and B are individual electron micrographs of ternary complexes of SOS gp140 (A) and YU2 gp120 (B). The Fc region of MAb 17b is aligned downward. Panels C and F are averaged electron micrographs of ternary complexes of SOS gp140 (C) and gp120 (F). Panels D and G are masked and averaged electron micrographs of the SOS gp140 complex (D) and the gp120 complex (G). Panel E represents the density remaining upon subtraction of the gp120 complex (G) from the gp140 complex (D). In panels D and E, the arrow indicates the area of greatest residual density, which represents the presumptive gp41ECTO moiety that is present in SOS gp140 but not in gp120. Panel H indicates the outline of the gp120 complex (G) overlaid upon a ribbon diagram of the X-ray crystal structure of the gp120 core in complex with sCD4 and the 17b Fab fragment (PDB code 1GC1) (33). The gp120 complex was enlarged to facilitate viewing. Bar, 40 nm (A to G) or 10 nm (H).

