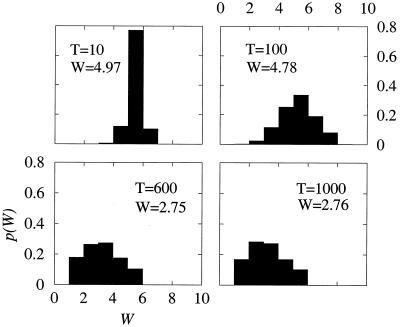
FIG. 2.
Distribution of fitness values at different plaque transfers. The probability distributions P(W) were calculated at transfers T = 10, 100, 600, and 1,000, by using the following constant values for the parameters: W0 = 5, p = 0.01, q = 0.001, and r = 5. Each distribution has been obtained as an average of 200 independent trials. The W value in each panel is the average fitness of the genome distribution (filled boxes). The numerical model and computer programs used are described in Materials and Methods.

