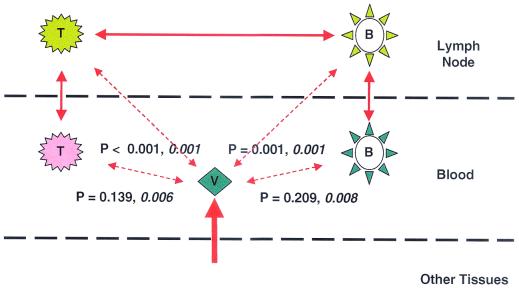
FIG. 5.
Schematic representation of the relationships between viruses in cellular compartments and plasma from patients 9 and 11. Virus populations from each of the four cellular compartments and plasma (V) are represented schematically. Levels of relatedness between pairs of compartments, as indicated by bidirectional arrows, were determined statistically by establishing the likelihood that the two populations being compared were the same. When P values were significant (indicating that the populations being compared were significantly different) for either both patients or one of the two patients, the arrows are broken and the P values are shown (values for patient 11 are shown in italic type). The thickness of the lines represents the degree of virus trafficking suggested by the phylogenetic and statistical analyses shown. Since little of the cell-associated virus is closely related to virus in plasma, much of the virus in plasma is derived from other tissues (thickest line).

