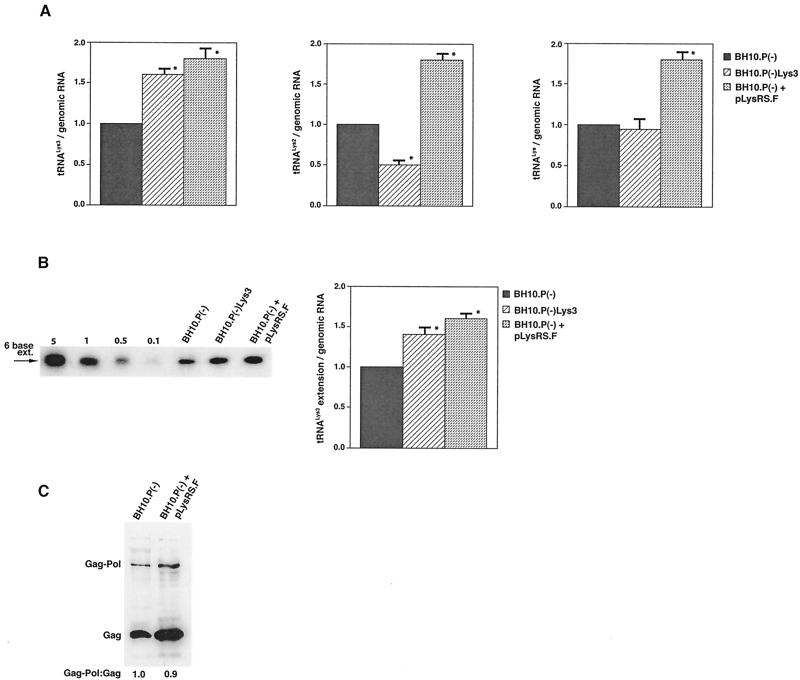
FIG. 4.
The effect of overexpression of LysRS upon tRNALys incorporation and annealing, GagPol incorporation, and viral infectivity. Protease-negative viruses were produced from COS7 cells transfected with BH10.P(−) or BH10.P(−)Lys3 or cotransfected with BH10.P(−) and pLysRS.F. (A) tRNALys incorporation. Dot blots of viral RNA were hybridized with DNA probes complementary to either tRNA or tRNA
 alone, to tRNALys (both tRNA
 and tRNA
 ), and to viral genomic RNA. The results were quantitated by phosphorimaging, and the ratios of tRNA
 , tRNA
 , or tRNALys to genomic RNA are plotted for the three viral types. Statistical analyses of the results are as described in the legend to Fig. 1. (B) tRNA
 annealing to viral RNA. Total viral RNA was extracted and used as the source of primer tRNA
 /genomic RNA template in an in vitro reverse transcription reaction, as described for Fig. 1B. Products were analyzed by 1D-PAGE with samples containing equal amounts of genomic RNA. Generation of the standard curve and statistical analyses of the results are as described in the legend to Fig. 2B. (C) Western blots of viral lysates, probed with anti-CA and anti-RT. The results, quantitated by phosphorimaging, are listed as the GagPol/Gag ratios beneath each lane.

