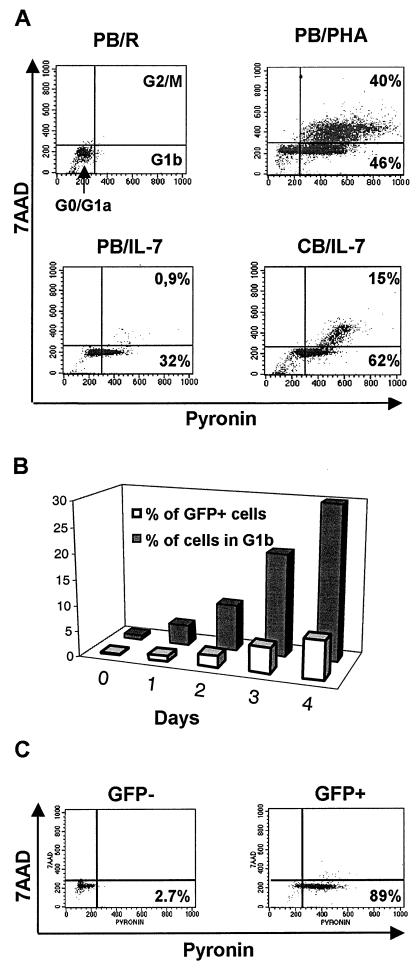
FIG. 6.
HIV susceptibility of IL-7-treated cells correlates with their cell cycle status. (A) Cell cycle analysis of resting (upper-left panel), PHA-stimulated (upper-right panel), or IL-7-treated PB (lower-left panel) or CB (lower-right panel) T cells. Cells were stained for DNA and RNA levels using 7-AAD and PY, respectively, and analyzed by FACS. FACS-quadrant correspondence of different cell cycle phases is shown in the upper-left panel. Percentages of cells having exited G0 are indicated in other panels. (B) Kinetics of entry in G1b and acquisition of transduction permissiveness to a GFP vector (MOI of 4) of resting T cells or cells cultured for 1, 2, 3, or 4 days in the presence of IL-7. (C) FACS-based analysis of the cell cycle status of GFP− and GFP+ population of IL-7-treated PB T cells exposed to saturating rounds of transduction with a GFP vector and sorted for transgene expression.

