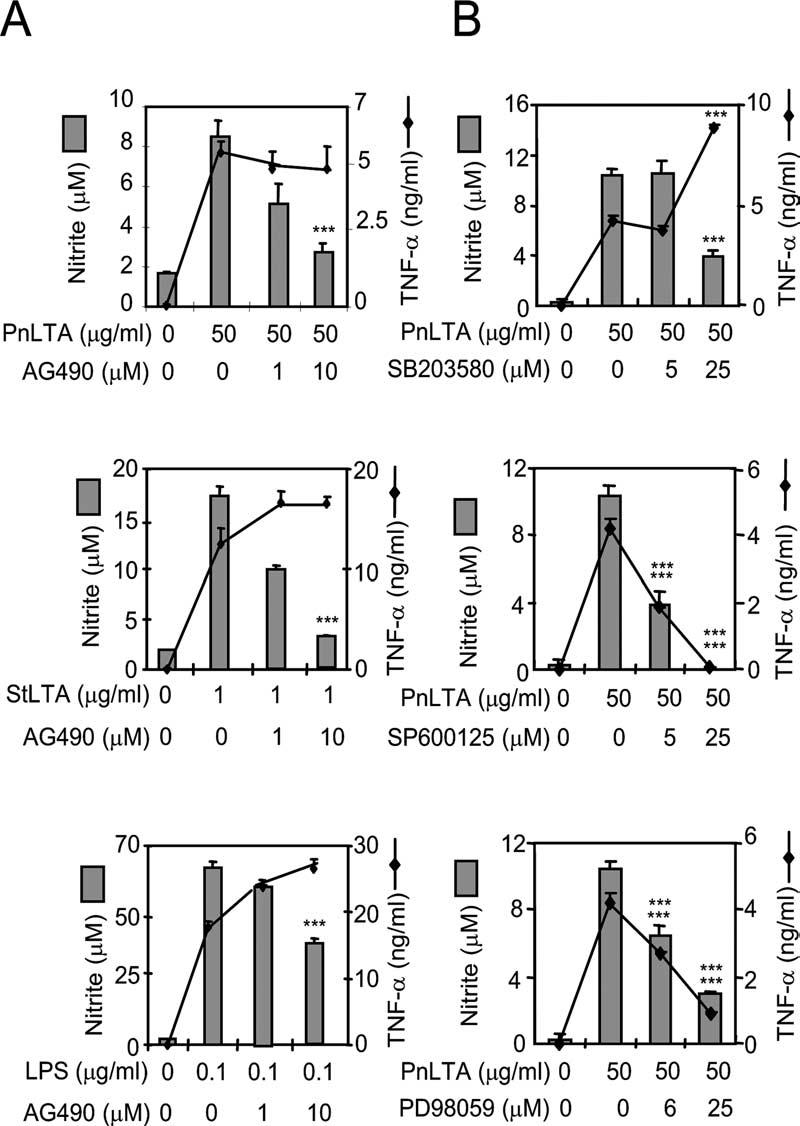
FIGURE 6.

Intracellular signal transduction for LTA-induced NO vs TNF-α production. A, RAW 264.7 cells were stimulated with PnLTA (50 μg/ml), StLTA (1 μg/ml), or E. coli LPS (0.1 μg/ml) in the presence of varying concentration of a Jak2 inhibitor (AG490). Culture supernatants were harvested after 16 h for the TNF-α determination or after 48 h for the nitrite determination. B, RAW 264.7 cells were pretreated with specific inhibitors for p38 kinase (SB203580), SAPK/JNK (SP600125), or Erk (PD98059) for 1 h and then stimulated with PnLTA (50 μg/ml) for 16 h for the TNF-α determination or 48 h for the NO determination. At the end of the culture period, the media were analyzed for TNF-α and nitrite levels. ***, A significant (p < 0.001) change in TNF-α or nitrite levels due to an inhibitor.
