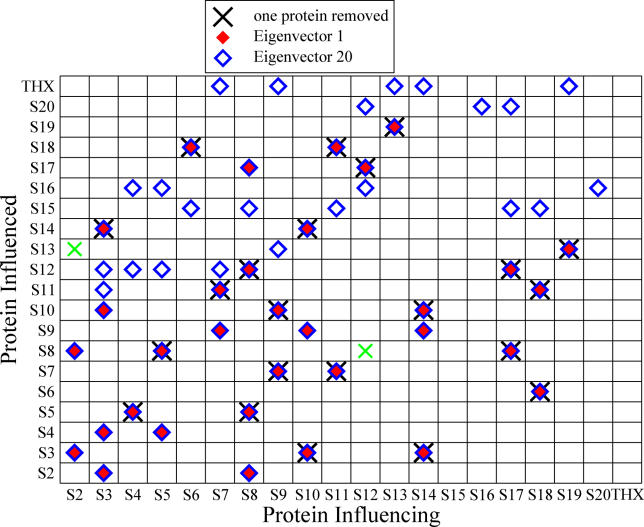
Figure 3. Color-Coded Contribution to Destabilization, Determined by Eigenvector Analysis of the Two-Protein Removal Experiment.
Red diamonds indicate contributions from the smallest and blue diamonds from the largest eigenvalue, respectively. The symbol × indicates influences that were already found in the one protein removal experiment of the previous section. The green × were discussed in the previous section. The respective energy differences of those two interdependencies are rather small and enter into the magnitude of entries of the eigenvectors only slightly. Entries for
 were marked if the value deviated more than 10% from their most likely value, while for
 this threshold was set to 1%, reflecting the respective order of magnitude of λ1/20.

