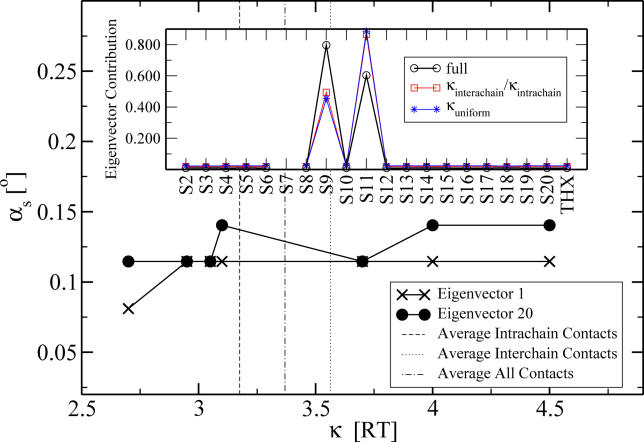
Figure 5. The Angle αs between the Respective Eigenvectors for an Interaction Strength κ of Protein S12 and for the Full Parameter Set.
The broken vertical lines indicate the average values used in the first two validation experiments in the section Sensitivity to Parameters. The full parameter set refers to the one in the Results section under Influence Map, Second-order stabilization revealed by two-protein removal.
Inset: Illustration of the deviation in the
 eigenvector contributions for the two different average interaction values (shown for the worst case of S7).

