. 2005 Jun 15;2(3):A10.

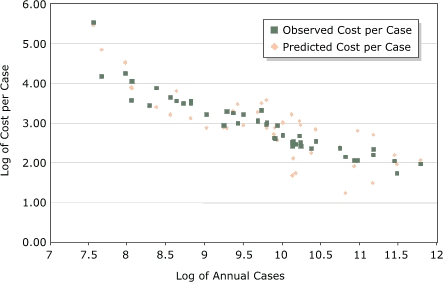
Figure 2.

This figure shows the observed and predicted log average National Program of Cancer Registries (NPCR) cost per case (x-axis) compared with the log of the number of cases reported (y-axis) for programs participating in the first 5-year funding period of the program. The model contained the average annual number of cancer cases reported, area (per 1000 sq miles), NPCR program type (enhancement or planning), and the 2000 consumer price index. The observed cost per cases is plotted with the predicted cost per case and shows that the average annual funds spent, annual number of cases reported, and average NPCR cost per case reported vary substantially among programs. The log average cost per case decreases as the log average of the total number of cases increases. In addition, the figure shows that numerous registries were spending more or less than predicted to report a case of cancer.

Observed and predicted log average National Program of Cancer Registries (NPCR) cost per case reported compared with the log of number of cases reported for programs participating in the first 5-year funding period of the program. Model contained average annual number of cancer cases reported, area (per 1000 sq miles), NPCR program type (enhancement or planning), and the 2000 consumer price index.