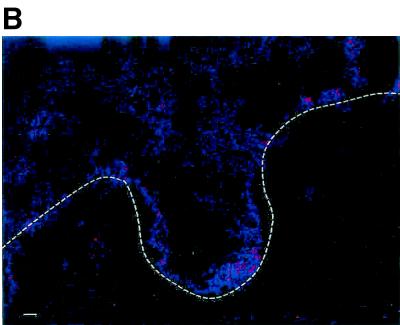
FIG. 4.
Identification of cell types that first become infected in cervical tissue during transmission of HIV-1. Tissues from a single patient were exposed to cell-free HIV-1 BAL for 6, 24, and 96 h and then analyzed for the identification of cell types expressing HIV-1 gag-pol mRNA by simultaneous two-parameter immunophenotyping and ultrasensitive fluorescence in situ hybridization as previously described (3, 22). (A) Tissues stained with CD4, CD45, and CD1a antibodies and hybridized with HIV-1 gag-pol probes. T cells are indicated by arrows, and Langerhans cells are indicated by arrowheads. The inset (scale bar = 10 μm) is a three-dimensional, three-parameter, laser confocal image of a productively infected CD4+ CD45RO+ T cell at 24 h postinfection. This infected cell demonstrated a globular distribution of HIV-1 gag-pol mRNA (green) in the cytoplasm. Further, the distribution of CD4 (red) and the CD45RO (blue) isoform was irregular on the cell membrane. (B) Control tissue from the same individual as in panel A, stained with anti-immunoglobulin-phycoerythrin and anti-immunoglobulin-Cy5, and hybridized under the same conditions as in panel A with a sense probe cocktail. Scale bar, 20 μm. The dashed line indicates the epithelial-submucosal junction.


