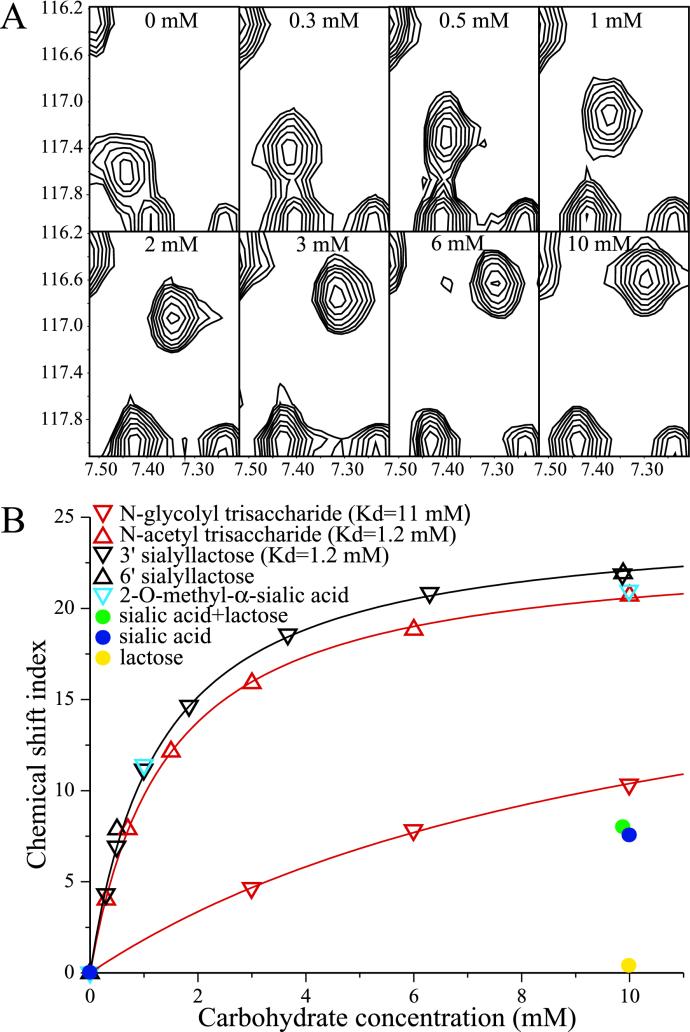
FIG. 2.
(A) Change in the HSQC amide peak position for R101 in the presence of various concentrations of 3′ sialyllactose (indicated at the top of each frame). The 15N-labeled Ec-VP846-231 concentration is 0.306 mM. The backbone amide 15N chemical shift (in parts per million) is given on the y axis, and the proton chemical shift (in parts per million) is given on the x axis. The R101 peak is the central peak seen migrating from the lower left to the upper right of the frames. (B) Plot of chemical shift index (ΔI) versus concentration of carbohydrate. The Ec-VP846-231 concentrations are between 0.282 and 0.306 mM, except for the samples mixed with lactose, in which the protein concentration is 0.228 mM. Measurements of chemical shifts in the presence of the N-glycolyl trisaccharide at 15 and 20 mM are not shown in the figure but were included in the determination of Kd. The determined Kds and hyperbolic fit curves used to determine ΔIholo are shown for the N-glycolyl trisaccharide, the N-acetyl trisaccharide, and 3′ sialyllactose.

