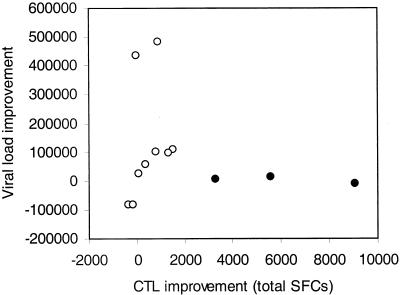
FIG. 4.
No correlation between changes in VL and changes in immune response. This figure demonstrates a nonlinear relationship between VL improvement (y axis) (difference between VL plateau after final cessation of ART and pretreatment VL) and CTL improvement (x axis) (difference between the mean of the total number of SFC after cessation of therapy and the total SFC at baseline of the first STI). Closed circles depict data for three patients with the strongest increase of CTL responses but no improvement in VL.

