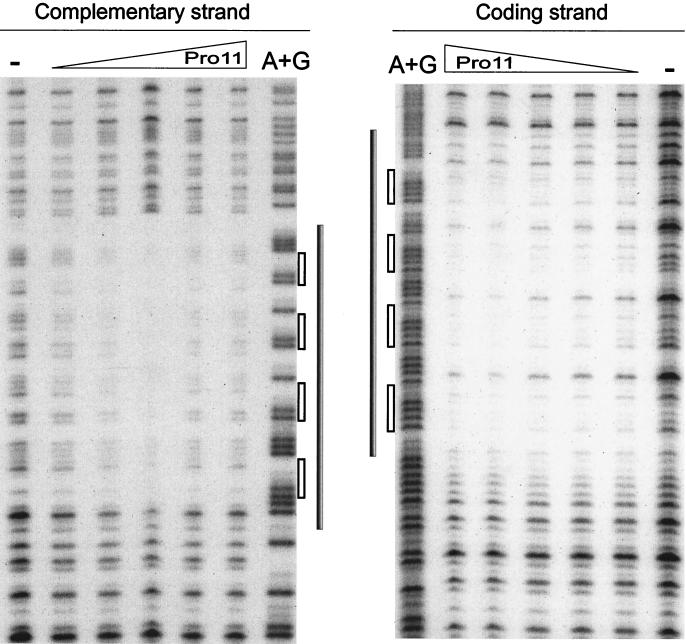
FIG. 4.
DNase I footprinting analysis of the Pro11-orf11F5R2 complex. The left panel shows complementary strand, and the right panel shows coding strand. A dash above a lane indicates no Pro11 added. The triangles indicate the increase in the amounts of Pro11 present in the binding reaction (0.5, 1, 2, 4, and 8 RU). A+G: lane with the A+G Maxam and Gilbert reaction products of the same DNA fragment. Grey bars indicate the protected regions. Empty bars indicate the position of hexamers.

