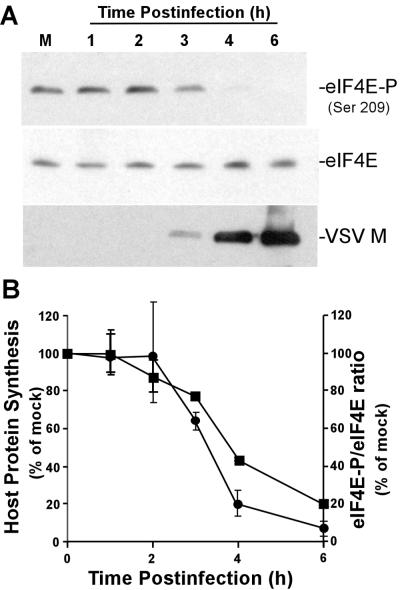
FIG. 2.
(A) Extracts from mock- and VSV-infected cells were resolved by SDS-PAGE, transferred to nitrocellulose, and analyzed by Western blotting with antibodies against eIF4E, eIF4E-P phosphorylated at serine 209 [eIF4E-P (Ser 209)], or the VSV M protein. Shown is a single blot reprobed with the three different antibodies. M, mock infection. (B) Quantification of host protein synthesis inhibition (closed squares) and eIF4E phosphorylation (closed circles). The rate of host protein synthesis was determined from experiments like that shown in Fig. 1 by quantitation of the radioactivity between the viral L and G bands, between the P and M bands, and in the region below the M band. The levels of eIF4E phosphorylation were determined by densitometry of phospho-eIF4E-specific Western blots and quantitated as a ratio to total eIF4E. The data shown are means ± standard deviations of three experiments.

