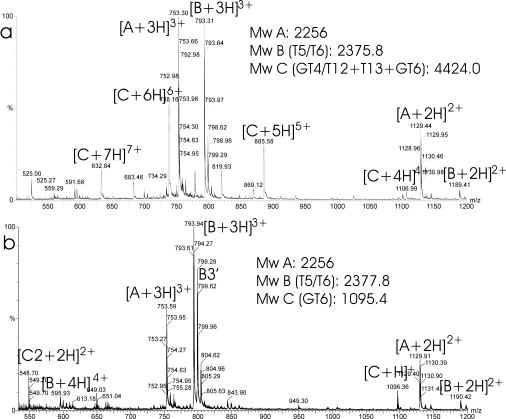
FIG. 4.
ESI-MS spectra of the fraction at 49.5 min (Fig. 2, bottom) before (a) and after (b) reduction with DTT. Each peak is labeled with an m/z ratio and a charge state designation. Calculated masses (A to D) are indicated in the figure. B corresponds to fragment T5T6. C corresponds to a disulfide-containing fragment that contains fragment GT6. Mw, molecular mass.

