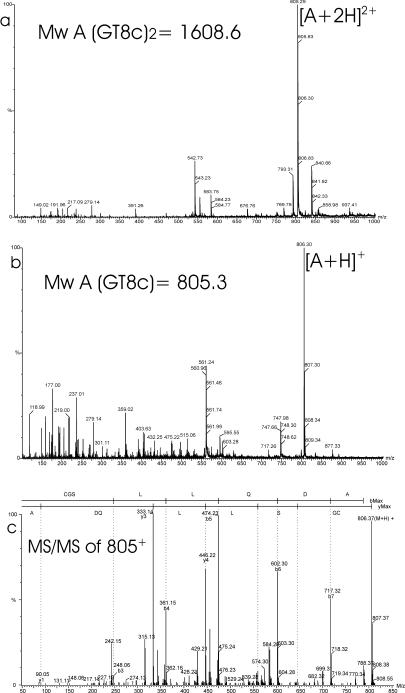
FIG. 5.
(a and b) ESI-MS spectra of the fraction at 58.6 min (Fig. 2, bottom) before (a) and after (b) reduction with DTT. Each peak is labeled with an m/z ratio and a charge state designation. A corresponds to fragment GT8c+GT8c. (c) Product ion mass spectrum of the peptide GT8c at m/z 805 (residues CGSLLQDA). The spectrum displays two series of peaks, the b ions and y ions, that allow the sequence to be elucidated. A part of the y-ion series consists of the masses 646.3, 559.3, 446.2, 333.1, 205.1, and 90.1, which correspond to the partial sequence S-L-L-(Q/K)-D-A. A part of the b-ion series consists of the masses 248.1, 361.2, 474.3, 602.3, and 717.3, which correspond to the partial sequence G-S-L-L-(Q/K)-D. Mw, molecular mass.

