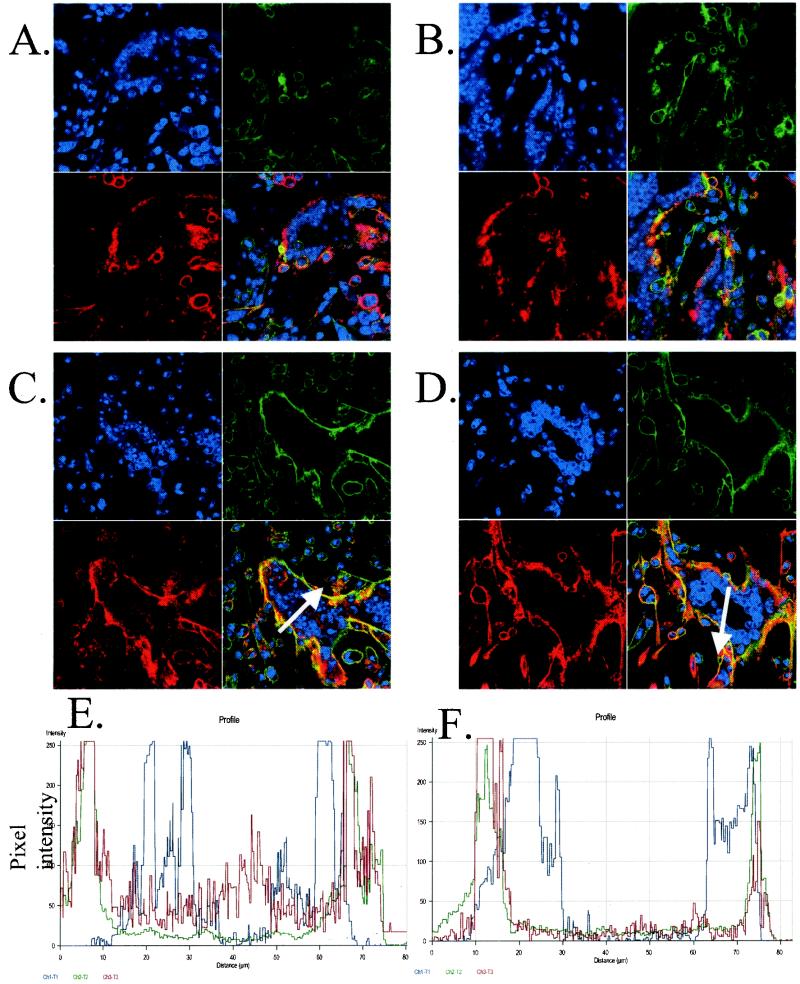
FIG. 4.
Endocytosis of VZV gE in cells infected with rOka or rOka-47S. (A, C, and E) rOka-infected cells; (B, D, and F) rOka-47S-infected cells. (A and B) Endocytosis at 0-min time point showing labeled gE (red) on the plasma membrane. Actin (green) was visualized with phalloidin, and the nuclei (blue) were visualized with TOTO-3. (C and D) Endocytosis after 60 min. Note the presence of red in the centers of the syncytia in the rOka sample but not in the centers of the rOka-47S sample. (E and F) Analysis of pixel intensity using the Zeiss software. White arrows in panels C and D overlie the analyzed lines. Note the high levels of red pixel intensity in the rOka sample but not in the rOka-47S sample.

