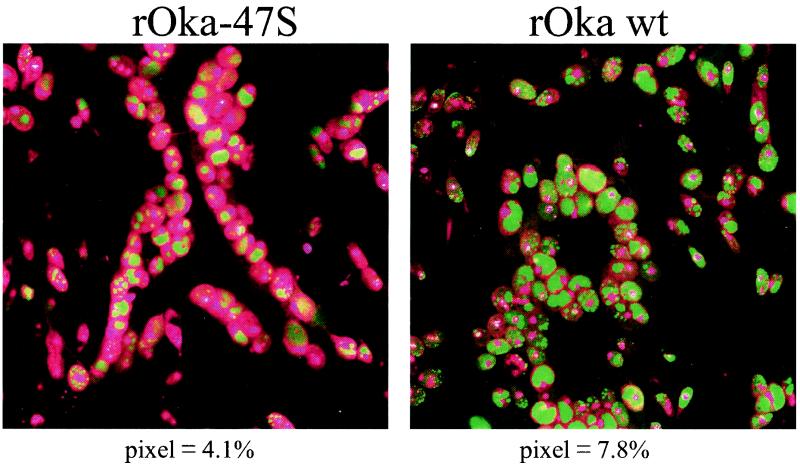
FIG. 9.
Identification of VZV IE62 in polykaryons. The 36-hpi micrographs immunolabeled for IE62 shown in Fig. 8 were enlarged in order to better illustrate the differences between cells infected with rOka and rOka-47S. To accentuate the contrast, the nuclei were pseudocolored magenta and the IE62 proteins were colored green. The numbers beneath each micrograph indicate the percentage of IE62 pixels exhibiting the highest intensity, as determined by a previously described assay (38). Note that VZV rOka-47S infection led to the formation of larger, more irregular syncytia, while those of rOka were smaller and circular.

