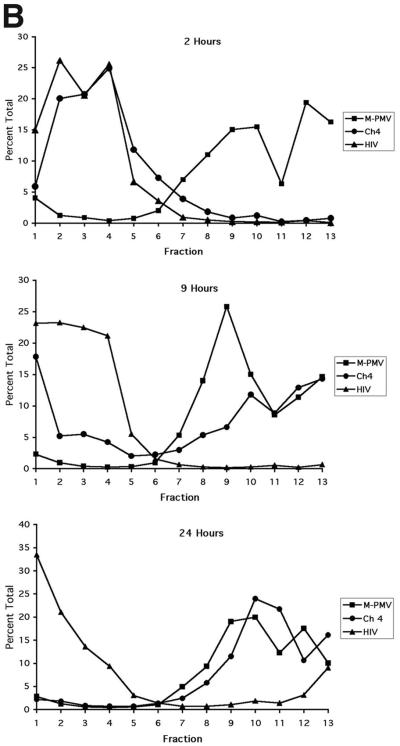
FIG. 2.
Example of time course of assembly by sucrose gradient analysis of chimera 4 versus M-PMV and HIV. (A) Aliquots of gradient fractions were electrophoresed on an SDS-10% polyacrylamide gel. Columns of panels are labeled at the top with the gag gene used to program the translation reaction. Rows of panels are of reactions allowed to incubate for 2, 9, and 24 h, as indicated at the left. Lane numbers indicate gradient fractions, beginning with the top fraction at no. 1. Lanes L contain an equivalent aliquot of the translation reactions before gradient fractionation. Lanes P contain material remaining as a pellet in the tube after removal of the gradient. Lanes 8 to 11 contain material indicative of immature capsid structures. The numbers to the left indicate the approximate positions of prestained molecular size standards in kilodaltons. Two major Gag species are visible for M-PMV Gag, Pr78gag and a slightly larger, truncated Gag-Pro protein that results from a frameshift. For both chimera 4 and HIV, only one major Gag species, Pr65.3 and Pr55, respectively, is produced due to the presence in these clones of a mutation to remove the frameshift. For all species, numerous smaller visible bands are presumed to be derived from internal initiations and/or abortive translations. (B) Quantitative representation of gel data. Radioactivity of Gag protein for each gradient fraction was quantified by phosphorimager analysis and is represented as a percentage of the total in lanes 1 to 12, plus P. Fraction 13 on the graphs corresponds to lane P on the gels.


