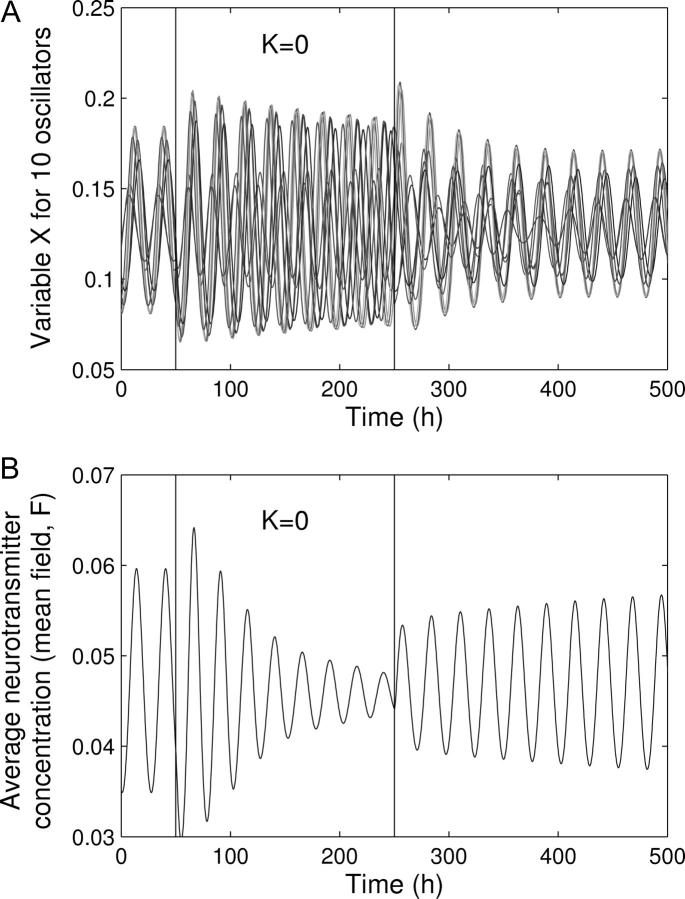
FIGURE 5.
Transient desynchronization of the oscillations. Shown are the oscillations of X for 10 oscillators randomly chosen among a total of 10,000 oscillators. During t = 50 h and t = 250 h (vertical lines), the oscillators are uncoupled (K = 0). During this period of time, each oscillator evolves toward its individual limit cycle characterized by its own period. After this period of time, the oscillators are rapidly resynchronized. Parameter values are the same as in Fig. 1.

