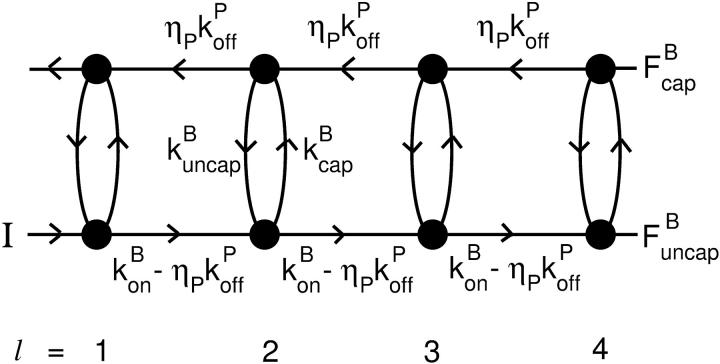
FIGURE 1.
Schematic of rate equation model for two capping-state system (Eq. 6). Uncapped filaments  enter at the point labeled I and grow at a rate
  until they become capped. Capped filaments
  shrink at a rate
  or become capped. Capping and uncapping rates are
  and
and  respectively.

