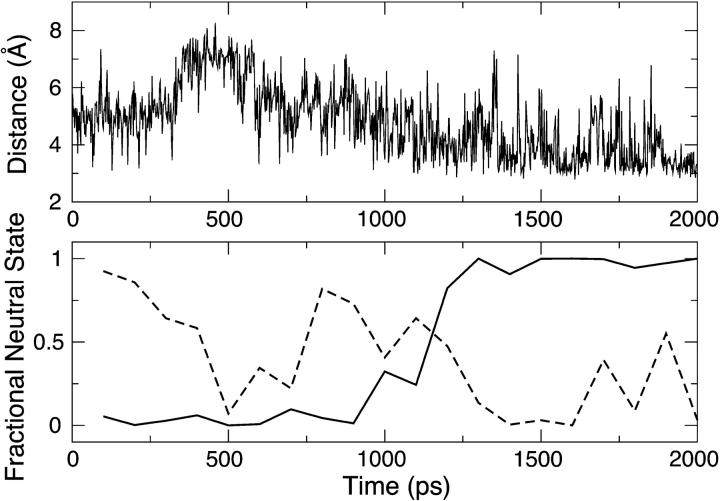
FIGURE 5.
Coupling between His12 and His119 in a 2-ns simulation of RNase A at pH 5. The top plot shows the time series of the distance between NE2 of His12 and ND1 of His119. The bottom plots shows the running fraction of neutral states for His12 (solid) and His119 (dashed) computed from 100-ps time windows.

