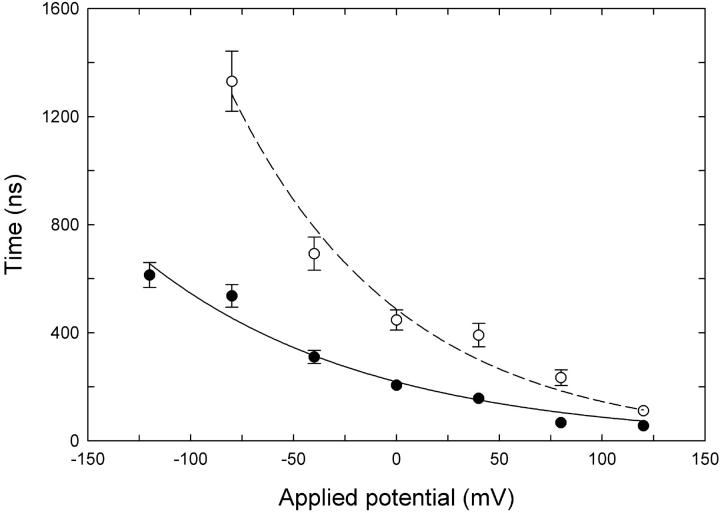
FIGURE 6.
Mean approach times from Brownian dynamics simulations. The mean time for a Cl− ion to enter the outer vestibule and approach within 7 Å from the Glu-148 side chain (closed configuration) is plotted against membrane potential. External Cl− concentration is 150 mM (•) or 50 mM (○). Each data point represents the average of 32–48 separate runs. Error bars have a length of 1 ± SE and are not shown when they are smaller than the data points.

