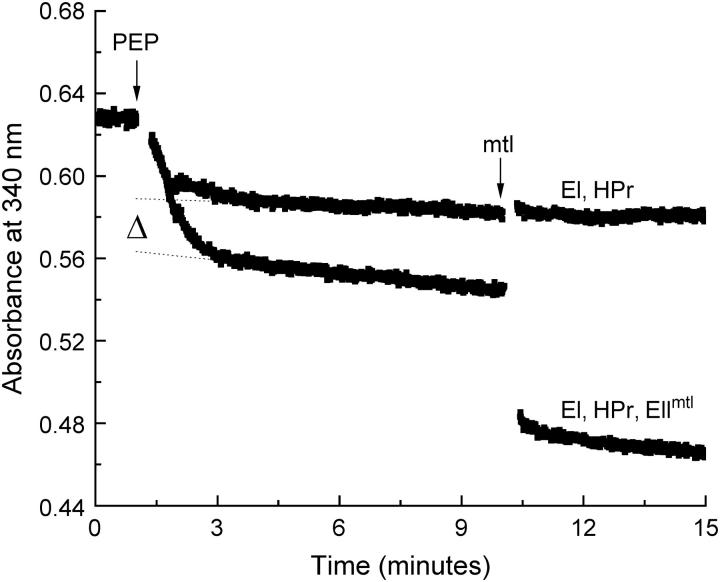
FIGURE 3.
Quantitative phosphorylation of EIImtl. The control mixture contained 52.8 units LDH, 2 μM EI, 4 μM HPr, 100 μM NADH, 20 mM Tris-HCl, pH 7.6, 5 mM MgCl2, 0.25% decylPEG, plus 1 mM DTT. EIImtl was added to a concentration of ∼4 μM. The reaction was started by addition of 1 mM PEP, and monitored by following the change in absorbance at 340 nm (ɛNADH = 6220 L mol−1 cm−1). After 10 min, when the reaction was complete, 10 μM of mannitol was added. The dotted lines represent linear fits through the data points after the reaction was complete. Extrapolation to the point where PEP was added yielded the amount of phosphate groups donated. The difference between the control (no EIImtl) and the sample with EIImtl yielded the amount of phosphorylation sites associated with EIImtl (Δ).

