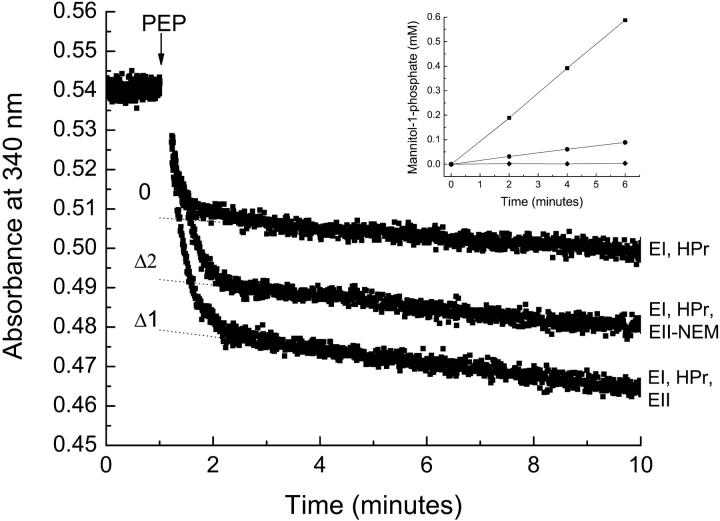
FIGURE 6.
Quantitative phosphorylation of Cys-384-quenched EIImtl. For experimental conditions see legend of Fig. 3. The dotted lines represent linear fits through the data points from 4 to 10 min. The difference between the control (EI, HPr) and EIImtl (with (Δ2), or without (Δ1) NEM) is the amount of phosphorylation sites associated with EIImtl. The inset represents the phosphorylation activity of the EIImtl samples, i.e., the amount of mannitol-1-P formed in time; (▪) untreated sample; (•) NEM-quenched sample; (♦) blank sample with no EIImtl.

