FIGURE 3.
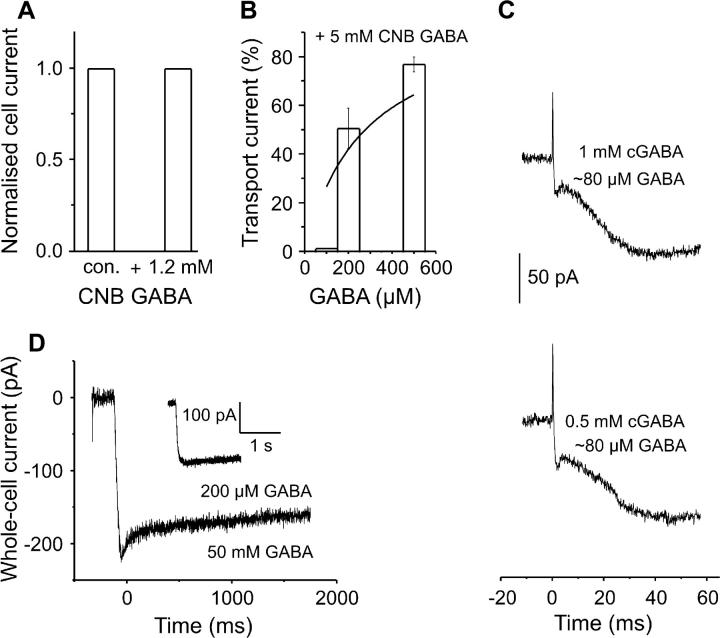
Electrophysiological characterization of the pharmacological properties of the αCNB-caged GABA. (A) Effect of 1.2 mM caged GABA on steady-state currents induced by 200 μM GABA (n = 2 cells). (B) Inhibitory effect of 5 mM caged GABA on GABA-induced steady-state currents (indicated by the bars); the solid line represents a Michaelis-Menten plot of GAT1 currents in the presence of 5-mM caged GABA. The values are mean values obtained from five cells and the error bars are mean ± SE. (C) Pre-steady-state currents obtained from the same cell with two different CNB-caged GABA concentrations (1 and 0.5 mM) at two different laser energies (165 and 244 mJ/cm2, respectively); the released GABA concentration (∼80 μM) was estimated by comparison of Iss with that generated by rapid perfusion of the same cell with 200 μM external GABA, by using the GABA dose response curve of Fig. 1 B. (D) GAT1 currents induced by a supersaturating GABA concentration jump (50 mM GABA) delivered in the bath solution by means of a rapid solution exchange system. The inset shows the typical 200 μM GABA-induced current from the same cell.

