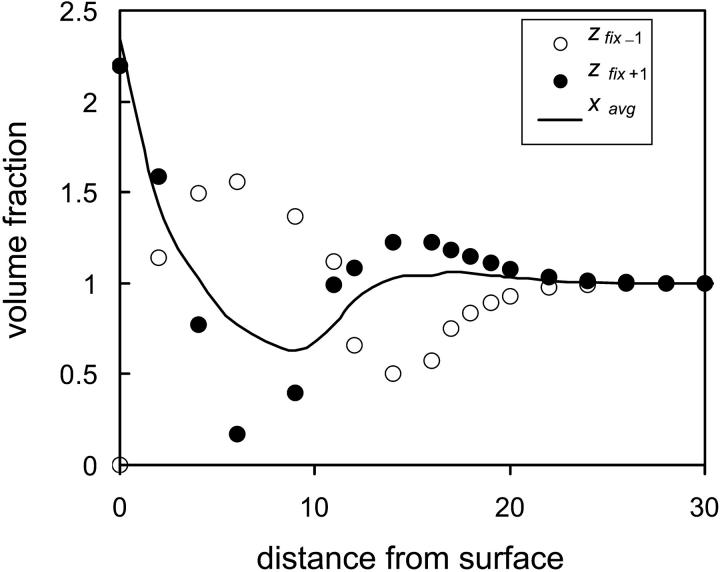
FIGURE 7.
Density profiles of the protein as a function of distance from the surface in the presence of a grafted hydrophilic polymer layer (N = 16, σ = 0.1, and χ12 = ±0.2) one lattice unit toward the surface measured from the center of mass of the protein (open circles); one lattice unit away from the surface (solid circles); and average density in the transverse direction (solid line).

