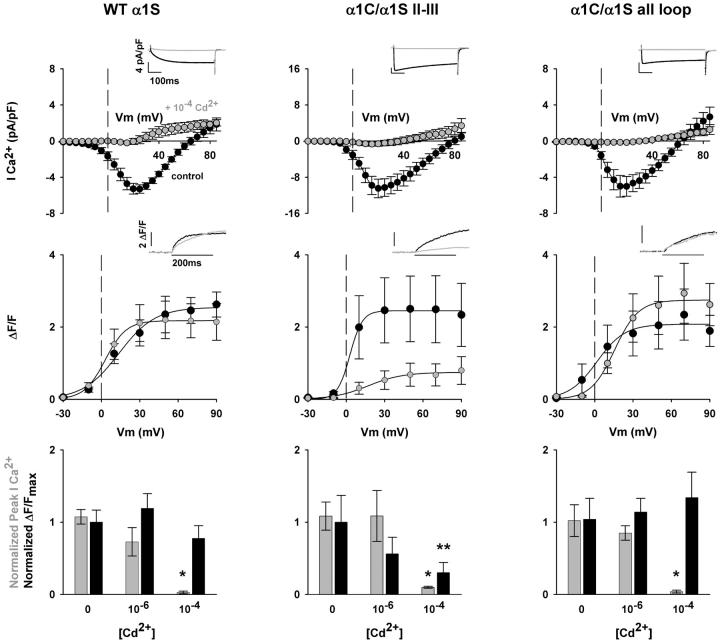
FIGURE 5.
Cd2+ block of Ca2+-dependent EC coupling promoted by the II-III loop chimera. Columns show representative mdg myotubes expressing the II-III loop and all loop chimeras. The left panel shows myotubes expressing WT α1S used as control. The top graphs correspond to population average current-voltage curves for depolarizations of 500 ms from a holding potential of −40 mV. Insets show representative Ca2+ currents elicited at +30 mV from a holding potential of −40 mV. With the exception of the bar graphs at the bottom, all shaded traces and shaded symbols are in 10−4 M CdCl2 added to the bath solution. The middle graphs show population-averaged Ca2+ transient-voltage relationships for depolarizations of 200 ms from a holding potential of −40 mV. Insets correspond to the spatial integral of the confocal fluorescence in ΔF/F units in response to a 200-ms depolarization to +30 mV from a holding potential of −40 mV. Fluorescence-voltage curves were fit with Eq. 1. Curves were fit with the following parameters (Fmax in ΔF/F units, V1/2 in mV, and k in mV, respectively): for WT α1S in 0 Cd2+, 2.5, 13.7, and 14.1; for WT α1S in 10−4 Cd2+, 2.2, 3.0, and 8.2; for α1C/α1S II-III in 0 Cd2+, 2.8, 2.8, and 4.7; for α1C/α1S II-III in 10−4 Cd2+, 0.7, 17.0, and 13.5; for α1C/α1S all loop in 0 Cd2+, 2.1, 1.7, and 10.9; for α1C/α1S all loop in 10−4 Cd2+, 2.7, 15.6, and 9.3. For a fit of parameters by cell and number of cells included in the fit, see Table 3. The bottom bar graphs correspond to normalized Ca2+ currents (shaded bars) and normalized ΔF/Fmax (black) in control solution without Cd2+, external solution with 10−6 M CdCl2, and external solution with 10−4 M CdCl2. Ca2+ currents at +30 mV were normalized to the population averaged Ca2+ current at +30 mV in the absence of Cd2+. ΔF/Fmax from a fit of individual cells was normalized to ΔF/Fmax from a fit of the population average in the absence of Cd2+.

