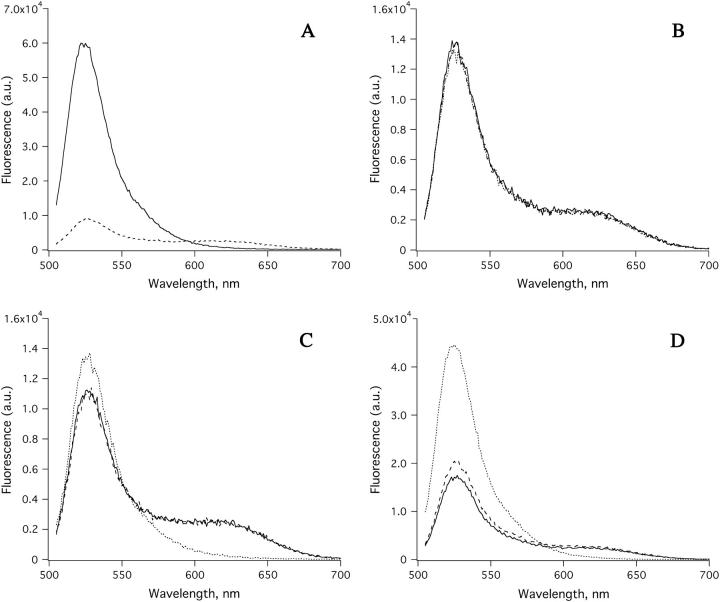
FIGURE 2.
Fluorescence emission spectral changes of a mixed population of vesicles loaded with either Fluo-3 or Fura-Red, subject to an ∼10-ns electric pulse of varying amplitude. (A) Control: Spectra of a solution containing a mixture of Fluo-3 and Fura-Red loaded vesicles (dashed line). Maximum emission obtained in the presence of 50 μM of Ca+2 plus 5 μM Calcium ionophore, 4-bromo A-23187 (solid line). (B) Dye-loaded vesicles alone (solid line); with 50 μM of Ca+2 (dashed line); with 50 μM of Ca+2 and subject to electric pulse of ∼80 kV/cm field strength (dotted line). (C) Dye-loaded vesicles alone (solid line); with 50 μM of Ca+2 (dashed line); with 50 μM of Ca+2 and ∼160 kV/cm field strength (dotted line). (D) Dye-loaded vesicles alone (solid line); with 50 μM of Ca+2 (dashed line); and with 50 μM of Ca+2 and ∼240 kV/cm field strength (dotted line).

