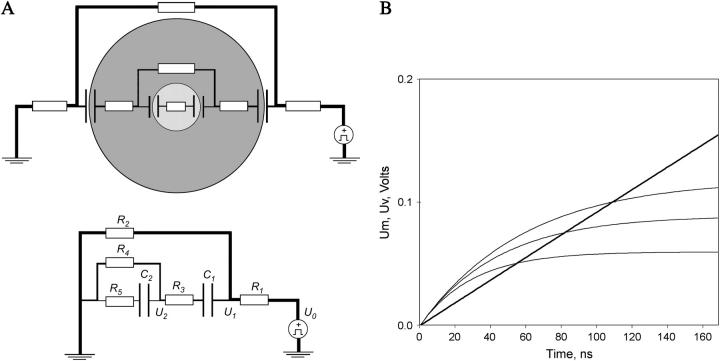
FIGURE 3.
A circuit model and simulation results for preferential electroporation of intracellular vacuole membranes (see Appendix for details). (A) The symmetry of the scheme shown on top has been simplified by combining serial membrane capacitances and media resistances into the corresponding capacitors and resistors shown in the bottom scheme. The equivalent circuit shown at the bottom represents a cell with membrane capacitance C1 external and internal resistances of R2 and R4, respectively. The inner vacuole capacitance is represented by C2 with internal resistance R5. The two membrane capacitances are being charged by current from an external source U0 through the two charging resistors R1 and R3. U1 is the voltage on C1 and U2 is the voltage on C2. The relative thickness of the conductors qualitatively represents the magnitudes of electric current flowing through the model components. (B) The temporal development of the field-induced membrane voltages across the membranes for various ratios of the vacuole/cell sizes. The membrane voltages for cell (thick line) and vacuole (thin lines) generated using Eqs. A6 and A17. Conditions: cell radius, 10 μm, ρe = 215 Ω m, ρi = ρv = 1 Ω m, Cm = 0.01 F/m2, E0 = 6.7 kV/cm. The charging time constant for the cell was 11 μs and 30, 45, and 60 ns for the 2-, 3-, 4-μm sized vacuole radii (from bottom to top), respectively.

